Memorandum
City of Lawrence
City Manager’s Office
TO: David L. Corliss, City Manager
CC: Diane Stoddard, Assistant City Manager
FROM: Britt Crum-Cano, Economic Development Coordinator
DATE: January 17, 2012
RE: 2011 Residential Lot Inventory
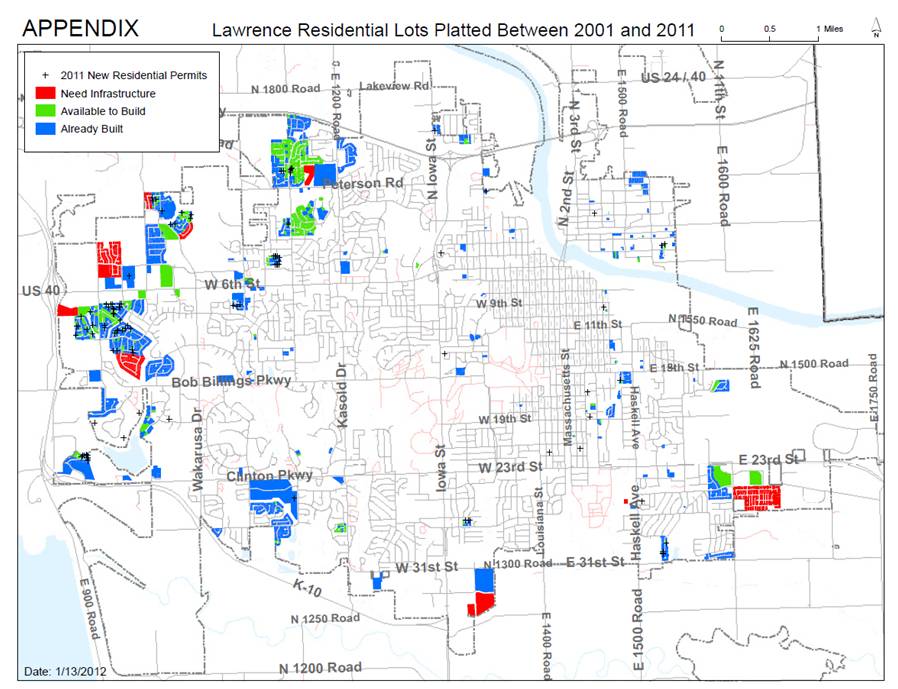
This report provides an update on the status of available lots for new residential construction as of December 31, 2011. Data focuses on building permits issued in 2011 as well as lots platted for residential construction from 2001-2011 (i.e. newer subdivisions). A map of the residential lots platted from 2001 through 2011, including building permits issued in 2011, is available at the end of this report.
Analysis shows that while the supply of available residential lots remained relatively steady over 2011, demand slowed substantially for single family homes. This had the effect of extending the inventory of development-ready lots (lots with infrastructure in place) available in newer subdivisions from 8 years in 2010 to 11 years in 2011.
The following is a snapshot of supply, market demand, and inventory of residential lots at the end of December 2011.
Supply of Residential Lots
At the end of 2011, 1064 undeveloped lots were available for residential construction (477 without infrastructure, 587 with infrastructure) in newer subdivisions.
Table 1: Residential Lots as of December 31, 2011[1]
|
Newer Subdivisions (Lots Platted After January 1, 2001) |
||||
|
|
# Lots |
% of Total |
Area (ac) |
Average Lot Size (ac) |
|
Undeveloped Lots—Without Infrastructure |
477 |
16% |
180 |
0.38 |
|
Undeveloped Lots—With Infrastructure |
587 |
20% |
227 |
0.39 |
|
Built Lots |
1,896 |
64% |
761 |
0.40 |
|
Total |
2,960 |
100% |
1,168 |
0.39 |
Not restricting data based on date platted,
there are a total of 1,746 platted, undeveloped residential lots available
throughout the City, implying that 682
(1,746-1,064 = 682) available lots are located in older subdivisions.
Table 2: Total Residential Lot Supply[2]
|
Residential Lot Supply as of December 31, 2011 |
|||
|
|
Newer Subdivisions (Platted after 1-1-2001) |
Older Subdivisions |
Total |
|
Undeveloped Lots—Without Infrastructure |
477 |
117 |
594 |
|
Undeveloped Lots—With Infrastructure (Development Ready) |
587 |
565 |
1,152 |
|
Built Lots |
1,896 |
19,327 |
21,223 |
|
Total |
2,960 |
20,009 |
22,969 |
Demand for New Residential Construction
There were 118 residential building permits issued in 2011 for a total of 466 units of new residential housing. Of the permits issued, 95 were for single family homes, four for duplex structures, and 19 for apartment buildings.
Table 3: New Residential Building Permits & Units[3]
|
2010 |
2011 |
|||
|
New Residential |
Permits |
Units |
Permits |
Units |
|
Single Family |
146 |
146 |
95 |
95 |
|
Duplex |
10 |
20 |
4 |
8 |
|
Apartment |
6 |
220 |
19 |
363 |
|
Total |
162 |
386 |
118 |
466 |
Both the number of single family and duplex residential units were down from the previous year, dropping 35% in the number of new single family homes (95 units in 2011 down from 146 in 2010) and dropping 60% in the number of new duplex units (8 units in 2011 down from 20 in 2010).
Apartment units showed continued growth, rising 65% from the previous year (363 units in 2011, up from 220 in 2010). Hunter’s Ridge Apartments at 550 Stoneridge Drive added the largest number of units. A total of nine building permits were issued for this project, representing 300 apartment units or 83% of the total number of apartment units for 2011.
5-Year Comparison: Demand for New Residential Units
 |
Estimated Inventory of Residential Building Lots
The inventory of available lots can be estimated by comparing both the supply of and demand for lots for new residential construction.
Demand Factor: Annual demand can be estimated using the number of building permits issued for new residential construction throughout the year. Since the majority of new residential permits are issued for single family homes, this analysis utilizes the number of single family building permits issued to represent demand for residential lots.
Supply Factor: The number of undeveloped, platted lots for new residential construction is utilized to represent the current supply of available lots.
Using 2011 data to represent current market conditions, the total residential lot inventory will last a little over 18 years. Lots in newer subdivisions are estimated to last approximately 11 years.
Table 4: Estimated Inventory Based on Current Market Demand
(95 permits/year)
|
Estimated Lot Inventory in Years |
|||
|
(Available Residential Lots as of December 31, 2011) |
|||
|
|
Stock in Newer Subdivisions |
Stock in Older Subdivisions |
Total Stock |
|
Undeveloped Lots—Without Infrastructure |
5.0 |
1.2 |
6.3 |
|
Undeveloped Lots—With Infrastructure (Development Ready) |
6.2 |
5.9 |
12.1 |
|
Total |
11.2 |
7.2 |
18.4 |
However, it should be noted that there were
fewer building permits issued in 2011 than any year going back to 1956. For
this reason, it is prudent to also examine inventory in light of historical
data based on recent trends in market demand. As shown below, when historical
demand is factored in, the total supply of residential lots is estimated to
last 8.6 to 14 years, with lots in newer subdivisions lasting approximately 5
to 8.6 years.
Table 5: Estimated Inventory based on 5-Year Market Average
(124 permits/year)
|
Estimated Lot Inventory In Years |
|||
|
(Available Residential Lots as of December 31, 2011) |
|||
|
|
Stock in Newer Subdivisions |
Stock in Older Subdivisions |
Total Stock |
|
Undeveloped Lots—Without Infrastructure |
3.8 |
0.9 |
4.8 |
|
Undeveloped Lots—With Infrastructure (Development Ready) |
4.7 |
4.6 |
9.3 |
|
Total |
8.6 |
5.5 |
14.1 |
When examining historical demand data over the past five years, the average number of single family building permits issued per year was 124, representing approximately 14 years of residential building lot inventory given the current supply of undeveloped lots. Lots in newer subdivisions are estimated to last approximately 8.6 years.
Table 6: Estimated Inventory based on 10-Year Market Average
(203 permits/year)
|
Estimated Lot Inventory In Years (Available Residential Lots as of December 31, 2011) |
|||
|
|
Stock in Newer Subdivisions |
Stock in Older Subdivisions |
Total Stock |
|
Undeveloped Lots—Without Infrastructure |
2.3 |
0.6 |
2.9 |
|
Undeveloped Lots—With Infrastructure (Development Ready) |
2.9 |
2.8 |
5.7 |
|
Total |
5.2 |
3.4 |
8.6 |
When examining historical demand data over the past ten years, the average number of single family building permits issued per year was 203, representing over eight years of residential building lot inventory given the current supply of undeveloped lots.
Lots in newer subdivisions are estimated to last approximately 5 years.